Weekly, Correlated Projected Fantasy Football Player Distributions
Fantasy Math simulates player projections thousands of times, taking into account factors regular rankings can't:
How it works
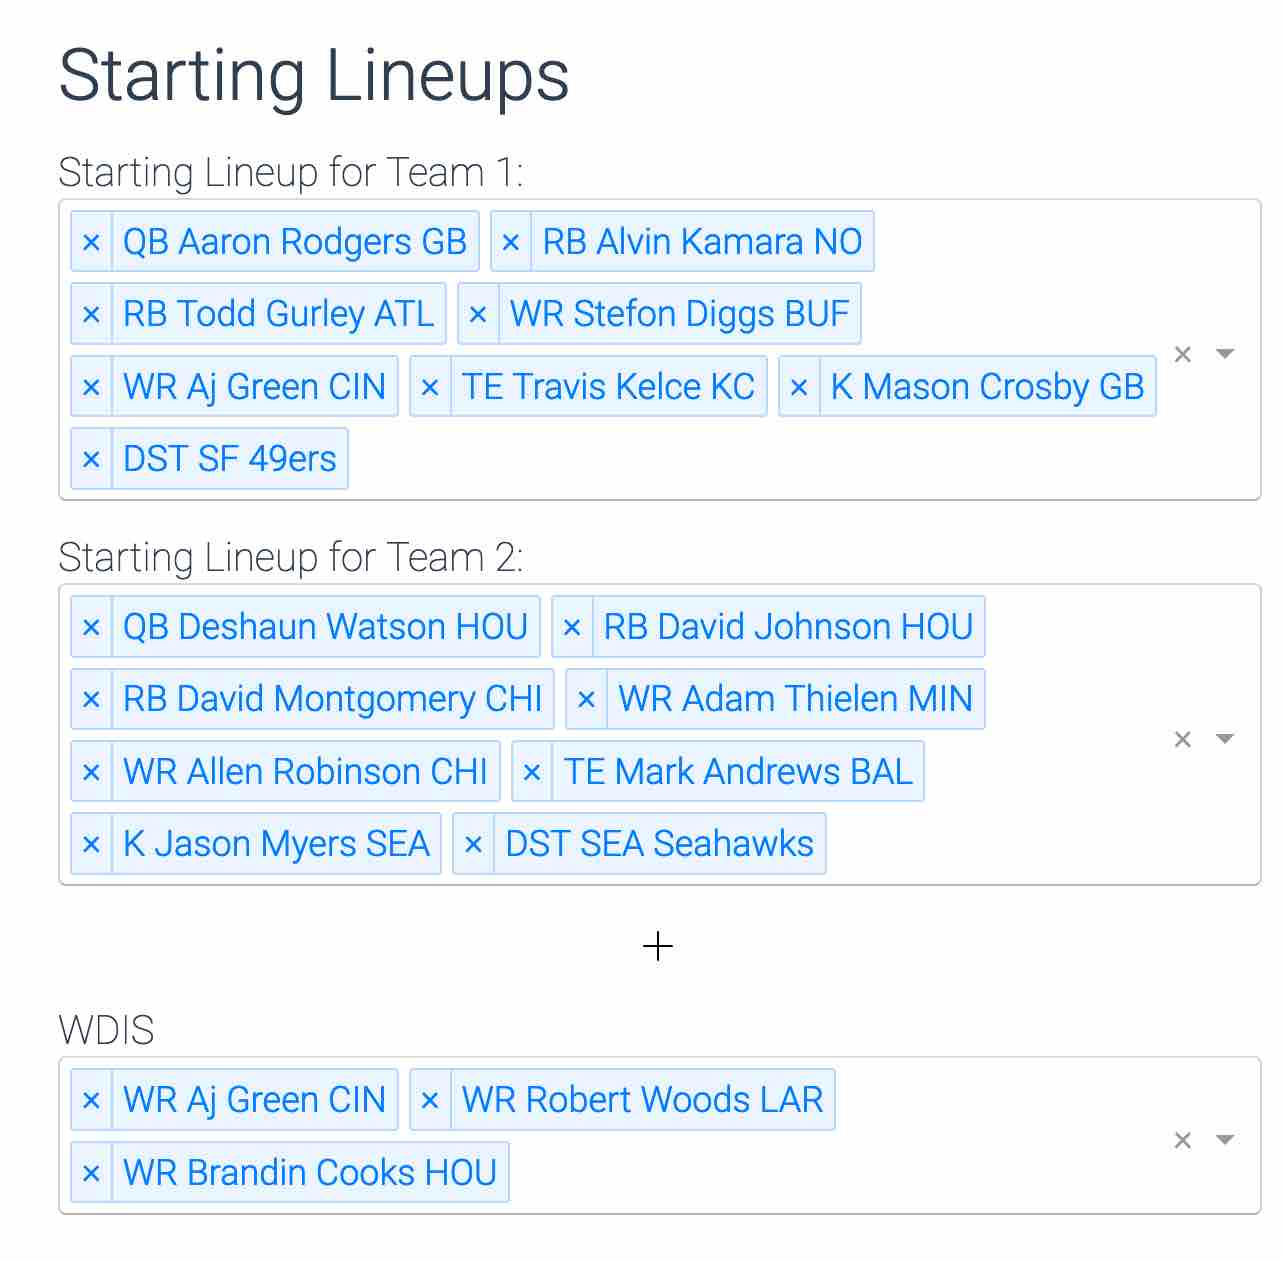
1. Enter your matchup
Including scoring systems, any midweek points (so you can run it after the Thursday night games, etc).
Once you enter your team, FM will remember them so it's easy to enter them again.
2. Behind the scenes, Fantasy Math models the distribution of each player's outcome
The computer simulates your matchup thousands of times, sampling from each player's probability distribution.
These distributions are fit using the expert fantasy consensus.
The more the industry disagrees about a player, the wider his range of possible outcomes.
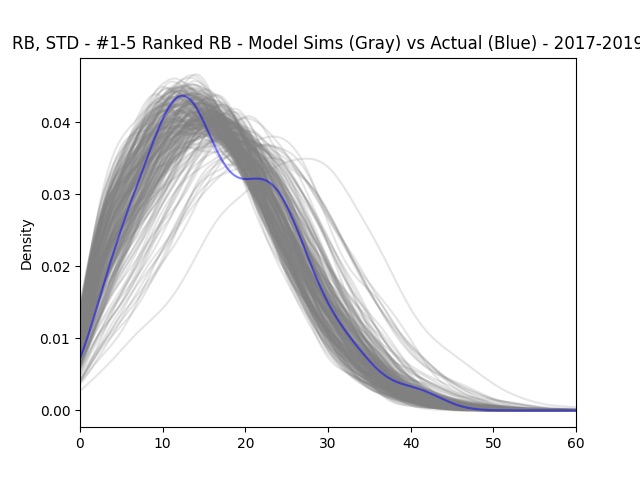
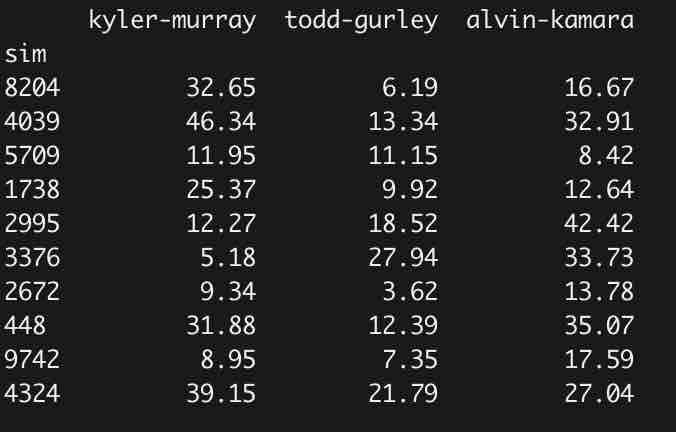
3. Fantasy Math samples these distributions to simulate YOUR matchup
The computer simulates your matchup thousands of times, sampling from each player's probability distribution.
Right: 15 random sims from a few of these players (in reality the model does 1-10k samples for each player on both teams, as well as all the guys you're contemplating starting).
4. These samples are correlated
These simulations not only fit well (gray lines above), they're also correlated . For example, our opponent here had Watson + David Johnson, who were playing the Ravens and Mark Andrews. Here's the correlation matrix of these simulations:
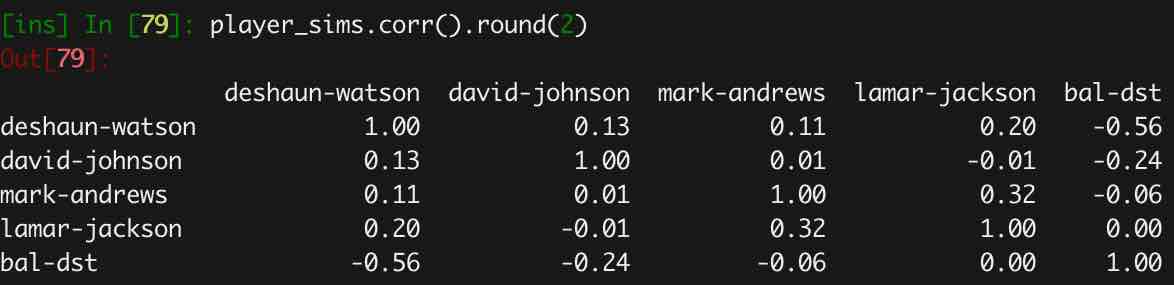
You can see Watson and DJ's simulations are positively correlated at 0.13 (historically the correlation for pts between a starting QB and RB). Watson is also positively correlated with Andrews and Lamar Jackson, and (strongly) negatively correlated with the BAL defense.
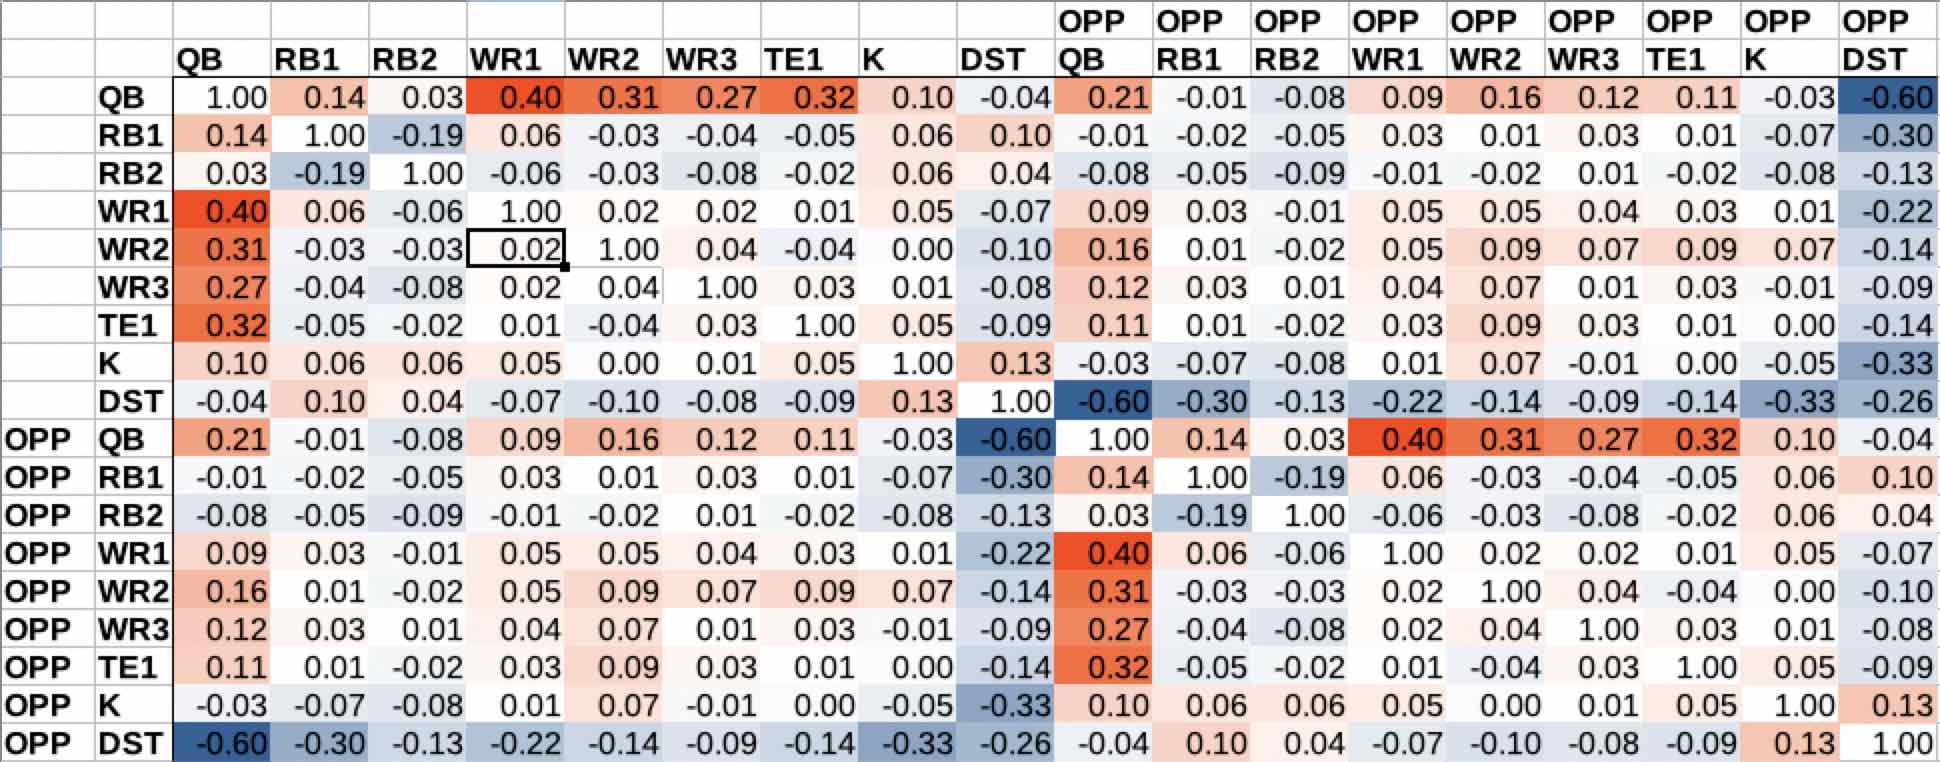
These are just a few players. The Fantasy Math Model factors in ALL of the following correlations:
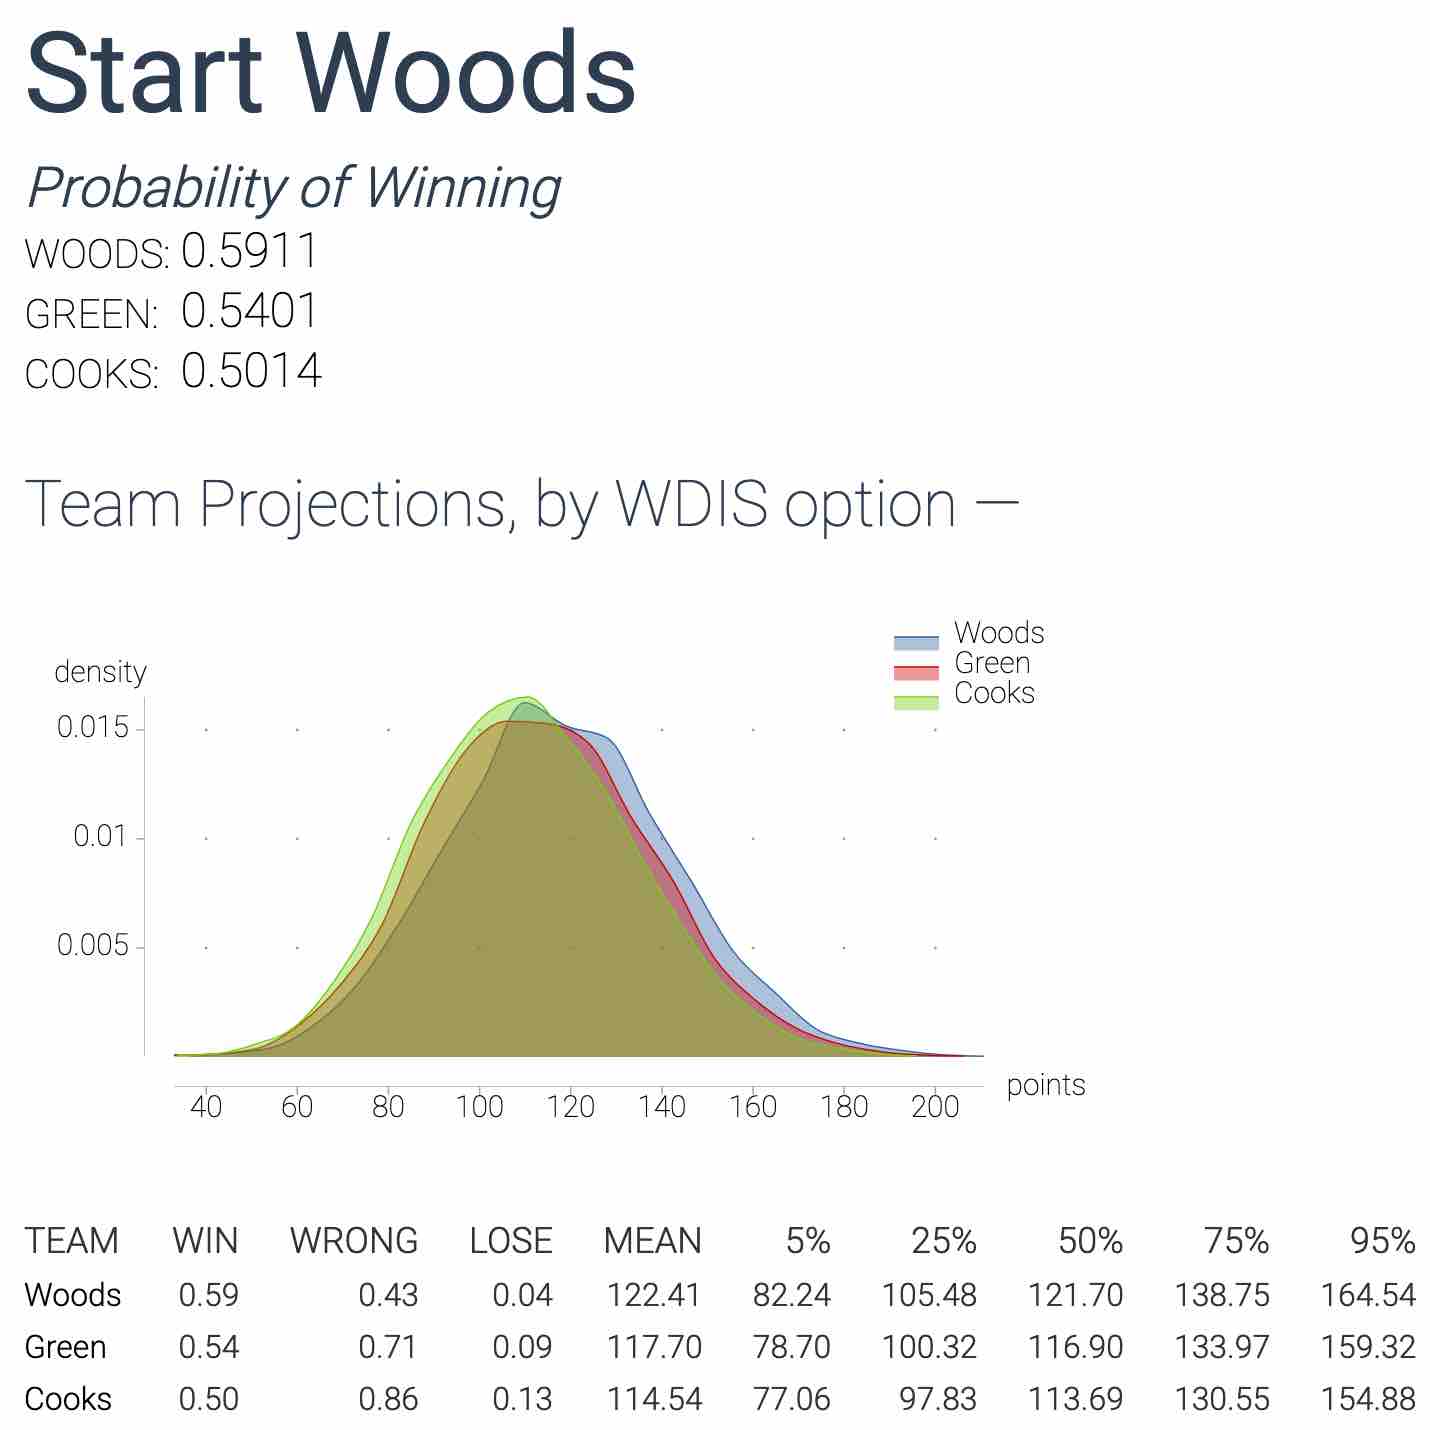
5. You get back who to start to maximize your chances
Once you click submit, and FM has simulated every scenerio (only takes a few seconds), you get back who you should start.
Along with your probability of winning with each player, FM also returns how often you can expect the advice to be WRONG (a backup outscores the reccommended starter)
It also tells you how often this decision will cost you your matchup (LOSE).
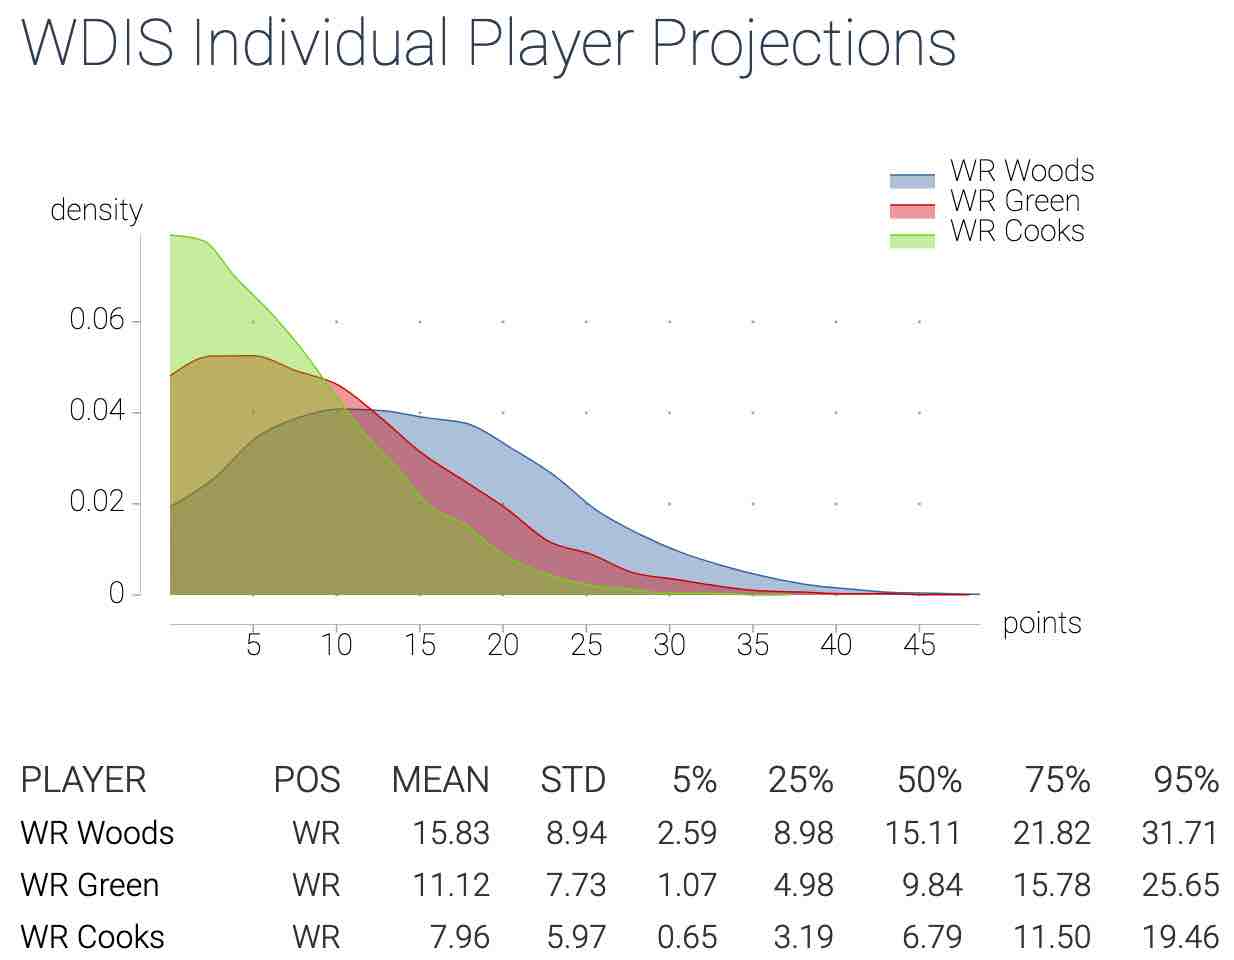
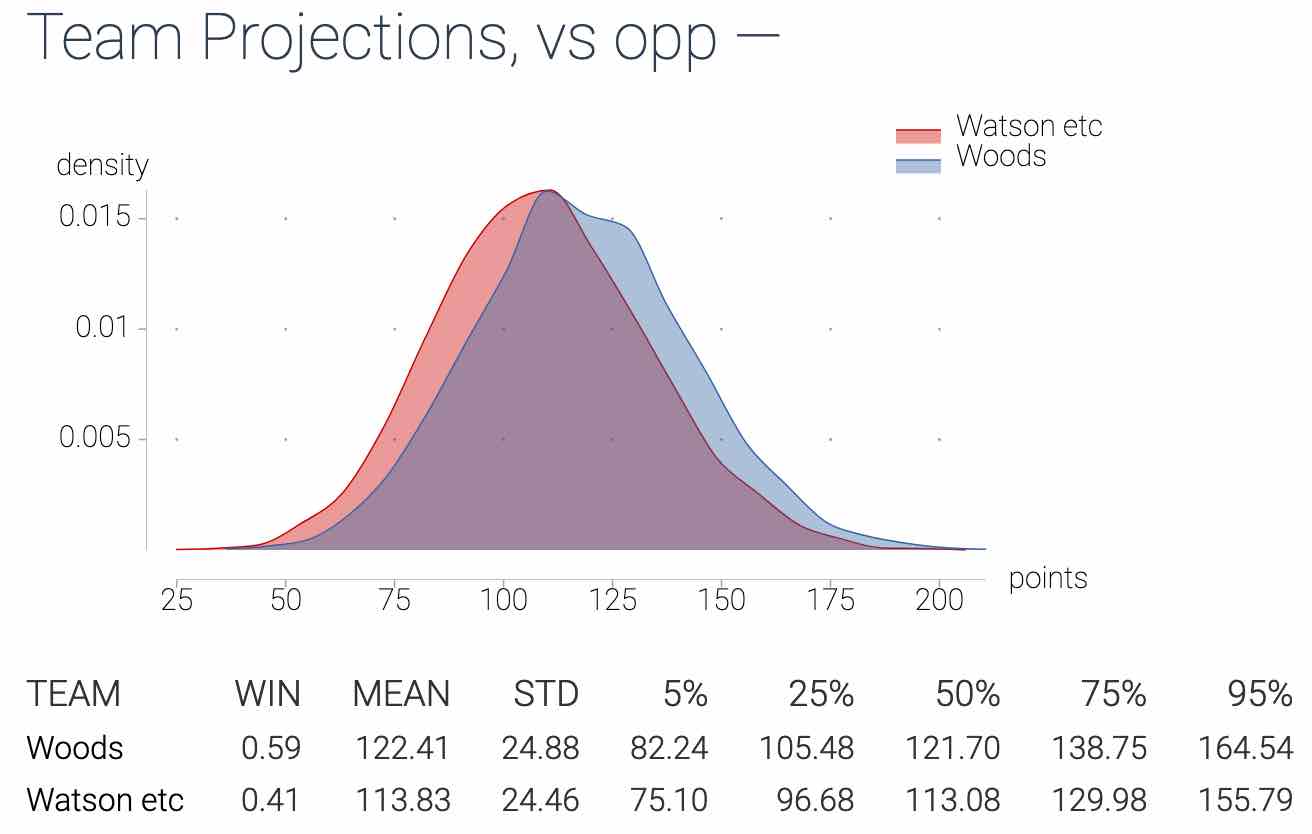
Finally, you also get a closer look at each individual player, as well as a look at your team (with the recommended starter) vs your opponent.
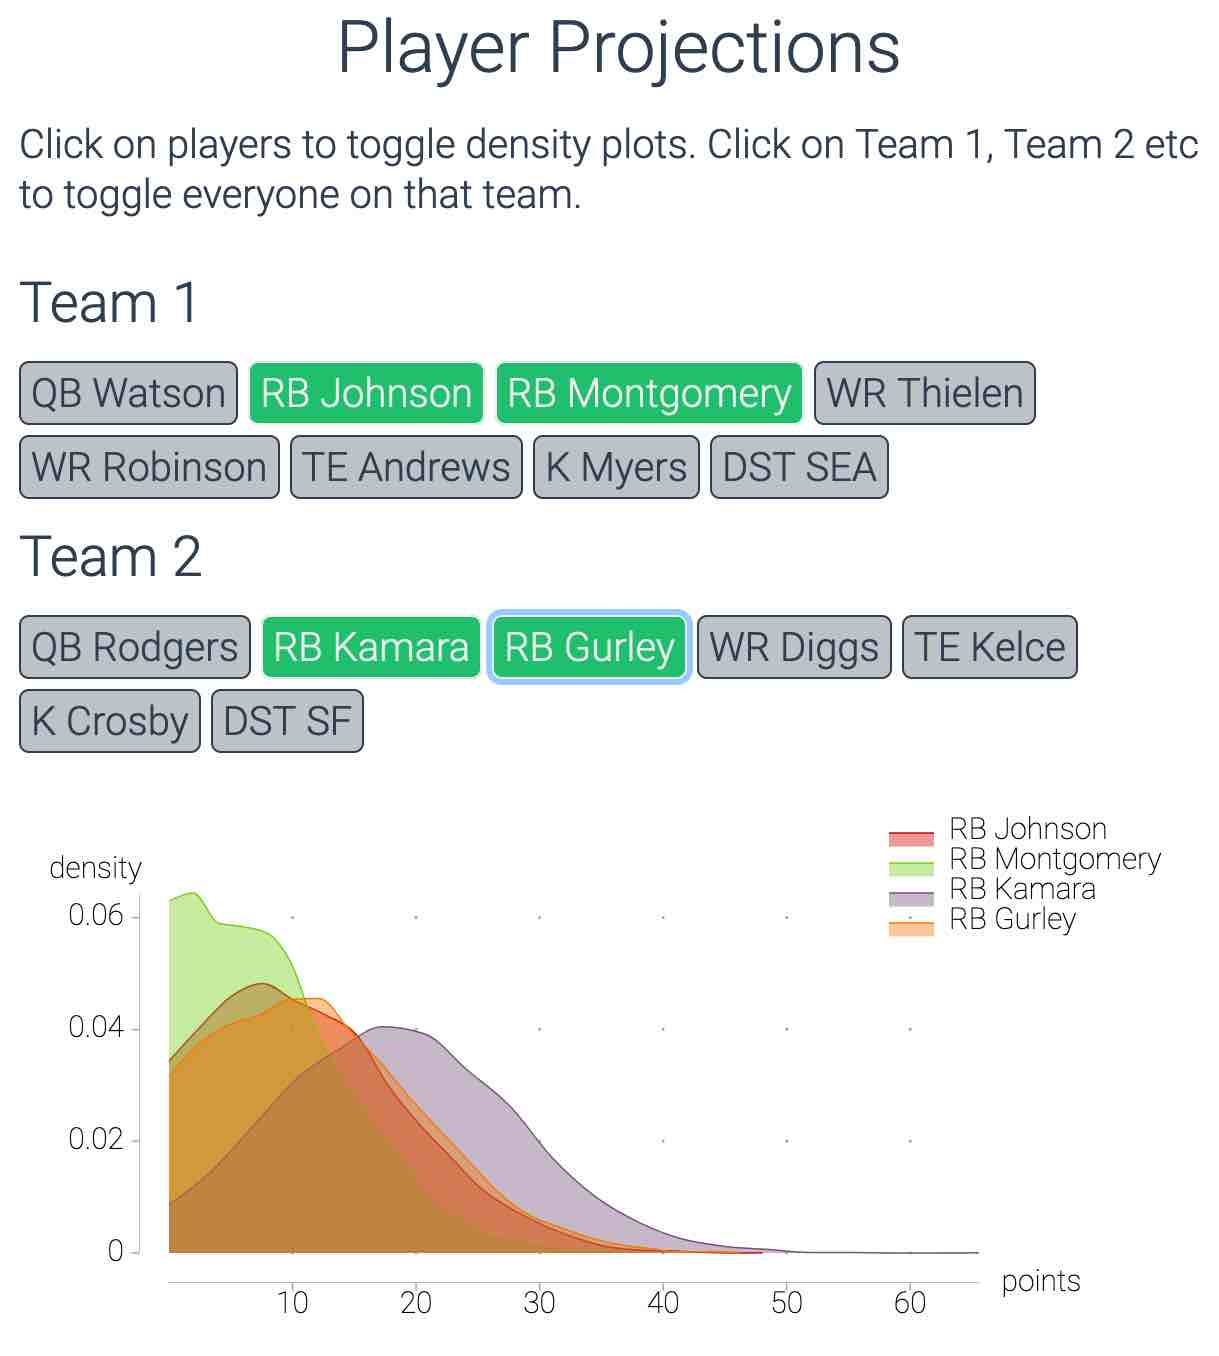
6. Also get in depth looks at the players on your team.
Toggle individual players distributions by position to see where you stack up vs your opponent and where you might improve.
It's also useful for sending people trade offers, showing them how a proposed trade helps their win probability this week.
Sound good?
Sign up for 2025
Includes weekly player projections, matchup and start-sit calculators for the 2025 season.
10,000 simulations
300+ correlations per game
Daily model updates
Unlimited leagues
Multiple scoring options
30 day money back guarantee!
30 Day Money Back Guarantee
Try it! If you're not satisified, contact me within 30 days and I'll refund you the purchase price.